



How to Build a Technical SEO Monitoring Stack for Large Websites
A technical SEO regression on a large site can remain unnoticed until the next scheduled audit, by which point it’s already had weeks or months to affect thousands of pages built from the same template.

Written byChitranshu Sharma
September 2, 2026
Quick Nav
A technical SEO monitoring stack for a large website is a connected system of tools and alerts that continuously tracks a site's crawl behavior, indexing status, rendering, performance, and search visibility, so that a regression is caught within days rather than at the next scheduled audit. Building one means instrumenting six distinct layers: infrastructure availability, crawl and indexation, rendering and performance, content and structured data, visibility and rankings, and business outcomes, then setting alert thresholds and assigning a named owner to each layer.
Methodology:This guide is grounded in Google Search Central’s own documentation on debugging search traffic and the Chrome UX Report’s published methodology, alongside recurring patterns observed in Growzify enterprise SEO reviews. Statements attributed to Growzify are practitioner observations, not confirmed Google ranking mechanisms, and the composite example later in this article is illustrative rather than a client case study.
Why a Monitoring Stack Is Different From an Audit
An audit is a snapshot. It’s accurate on the day it runs, across whatever pages and templates it happens to cover.
A large site doesn’t hold still that long. New templates ship. Content updates at scale. A platform release can change how a shared component behaves for every page built from it, all at once, without anyone flagging it as an SEO change.
A monitoring stack exists to close that gap. Instead of waiting for the next quarterly audit to discover a canonical tag broke across an entire product category three weeks ago, continuous monitoring can surface that same regression within days. On a site where one template defect touches tens of thousands of pages, that speed difference is the whole point.
This isn’t a replacement for periodic audits, either. Growzify’senterprise technical SEO checklistcovers the full-inventory review a structured audit still needs to do. This guide covers the system that watches those same areas continuously between audits.
The Growzify Enterprise Monitoring Stack
Most monitoring setups Growzify sees start with whatever’s easiest to instrument, usually uptime and Core Web Vitals, and stop there. That leaves real blind spots.
This is a practitioner framework Growzify uses to structure a complete stack, not a Google-documented model. It splits monitoring into six layers, each answering a different question about the site’s health.
| Layer | Core question | Primary data sources |
| Availability and infrastructure | Is the site up and responding reliably? | Uptime monitoring, server logs, CDN and WAF data |
| Crawl and indexation | Is Google reaching and indexing the right pages? | Search Console Crawl Stats, Page Indexing report, verified server logs |
| Rendering and performance | Are pages rendering correctly and loading fast enough? | Core Web Vitals field data, rendering checks, lab diagnostics |
| Content and structured data | Are templates producing accurate markup and content? | Structured data validation, template regression checks |
| Visibility and rankings | Is the site’s search presence changing, and why? | Search Console Performance report, rank tracking |
| Business outcomes | Is any of this translating commercially? | Analytics, conversion and revenue data |
Each layer catches something the others miss. Uptime monitoring won’t tell you a template shipped with broken structured data. Rank tracking won’t tell you why visibility dropped. The stack only works when all six feed into one place someone actually checks.
How the Layers Actually Connect
Each layer needs the same basic path from raw data to a person taking action, even though the specific tools differ by layer: a data source feeds a collection point, the collection point feeds monitoring logic that applies a threshold, a breach of that threshold triggers an alert, and the alert routes to a named owner.
In practice, that often looks like Search Console’s API, server logs, real-user monitoring, and a rendering crawler all feeding a central dashboard or data warehouse, threshold logic evaluating each metric against its own baseline, and a breach routing to a channel like Slack, Jira, or PagerDuty depending on urgency, addressed to whoever owns that specific layer. The tools change from one organization to the next; the five-step path from data to an accountable person doesn’t.
Layer 1: Availability and Infrastructure Monitoring
This is the foundation. A site Google can’t reliably reach undermines every other layer, no matter how well those layers are instrumented.
Uptime monitoring should check response times and status codes from outside the site’s own infrastructure. An internal health check can report “healthy” while external requests, including Googlebot’s, are actually failing.
Server response time matters specifically for search here too. Slow or unreliable responses can affect how much of a site Google is willing to crawl. Tracking 5xx error rates, DNS resolution failures, and CDN or WAF behavior that might be silently blocking legitimate crawler traffic all belong at this layer, since none of the three would show up in a rankings dashboard until much later.
Layer 2: Crawl and Indexation Monitoring
This layer answers whether Google is actually reaching and keeping the pages that matter. That’s a different question from whether the site is simply online.
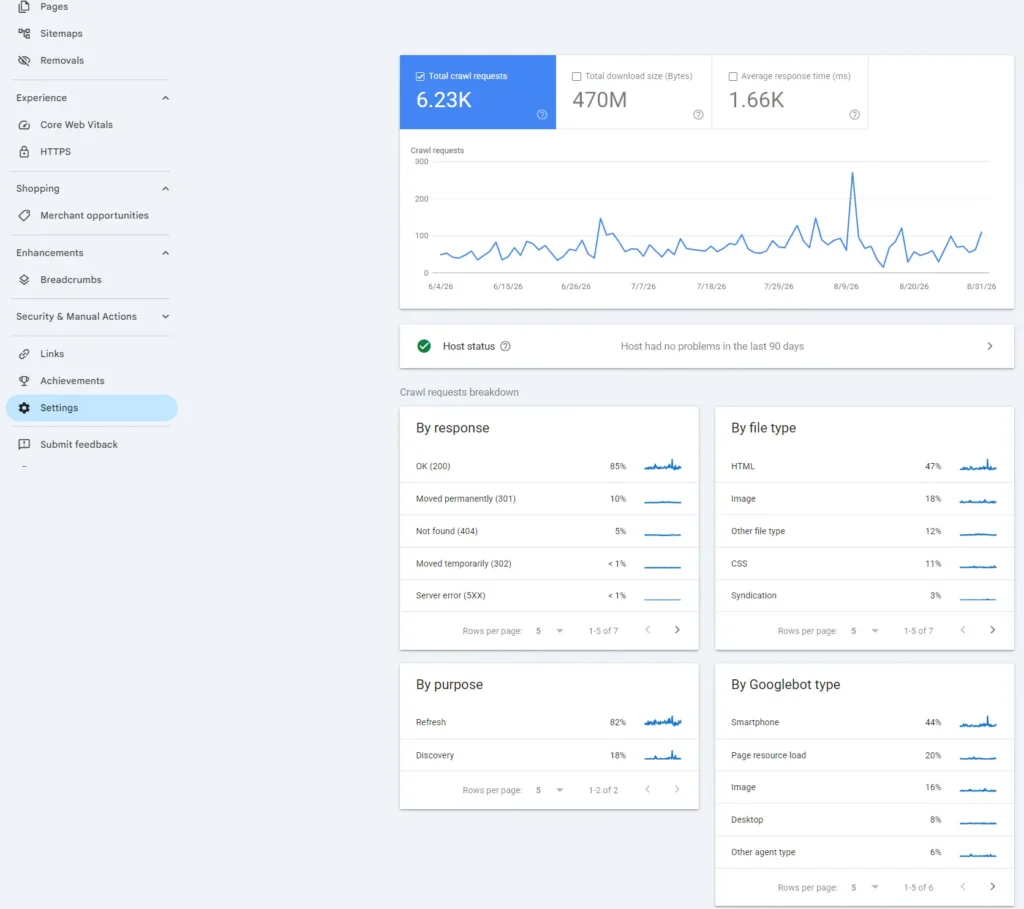
Search Console’s Crawl Stats reportshows crawl request volume, response codes, average response time, host status, and crawl purpose over time. A sudden crawl-volume change or a spike in crawl errors can provide an early diagnostic signal, worth comparing against recent releases, sitemap changes, inventory shifts, and server health rather than treated as a problem on its own.
The Page Indexing report tracks how many known URLs sit in a “Discovered, currently not indexed” state, meaning Google knows about the URL but hasn’t crawled or indexed it yet. A rise in that status across priority URL groups is worth investigating against crawl capacity and demand, URL proliferation, internal-link prominence, duplication patterns, and whether the affected cohort still warrants continued crawling priority, rather than assuming there is one single cause.
Verified server logs add the URL-level detail Search Console’s aggregated reporting doesn’t provide. They confirm exactly which pages a real crawler requested, not what a simulation predicted. Growzify’s guide onlog file analysis for large websitescovers how to turn that raw log data into an ongoing monitoring signal rather than a one-time pull.
Layer 3: Rendering and Performance Monitoring
A page can look fine to a human reviewer and still render incorrectly for search engines. This layer needs both field data and diagnostic tools working together to catch that.
The Chrome UX Report, the real-user dataset behind Search Console’s own Core Web Vitals reporting, reflects how actual visitors experience a site’s pages. Its own published methodology confirms the data is a rolling 28-day average, aggregated from real Chrome users, not a single lab test taken at one point in time.
That rolling window is exactly why CrUX data is a poor primary trigger for catching a regression right after a release. A new regression is initially diluted by the prior 27 days of data still in the window, so it can take time to become clearly visible at the field-data level, even though the underlying dataset itself updates daily. Real-user monitoring or synthetic checks run against key templates immediately after deployment are better suited to fast regression alerts, with CrUX data used afterward to confirm whether the change actually affected real visitors at scale.
Rendering checks matter separately from performance metrics. Confirming that a template’s critical content and links actually appear in the rendered output, not just the initial server HTML, catches a category of failure pure speed metrics miss entirely.
Layer 4: Content and Structured Data Integrity Monitoring
Templates change more often than most teams expect. A single deployment can quietly break structured data or content logic across every page built from that template, simultaneously.
Automated structured data validation, run against a representative sample from each template after every deployment, catches markup errors before they’ve had time to propagate across thousands of pages. Template regression checks, comparing title tag patterns, canonical logic, and core content blocks before and after a release, flag unintended changes a human reviewer would likely miss on a site this large.
This layer is specifically about detection, not judgment. Flagging that something changed is what monitoring does. Deciding whether that change was actually a problem still needs a person to look at it.
Layer 5: Visibility and Ranking Monitoring
This layer tracks how a site’s search presence is actually changing, and gives the earliest evidence for why.
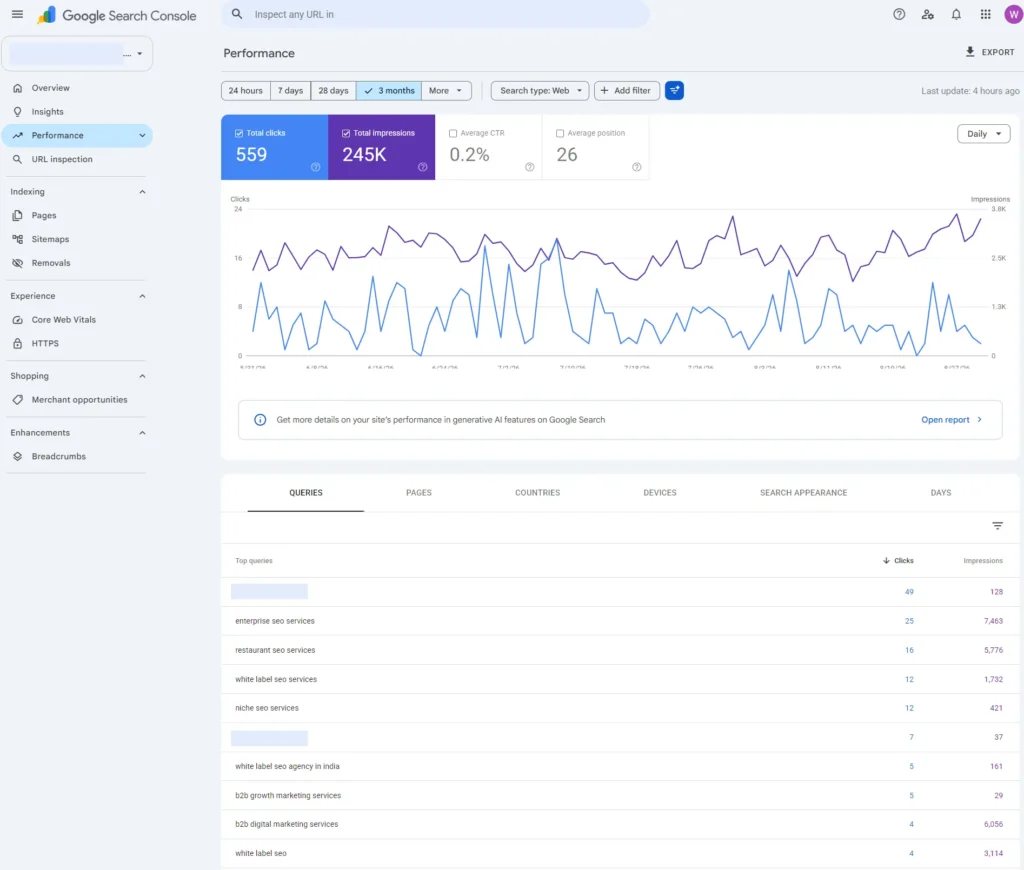
Search Console’s Performance report is the primary source here.Google’s own guidance on debugging search traffic dropsrecommends comparing impressions against clicks as the first split: if both fall together, Google’s own list of common causes points toward algorithmic updates, technical crawling or indexing errors, security or spam issues, seasonality, changing search interest, or a recent site migration, and recommends checking the Crawl Stats and Page Indexing reports specifically for a corresponding spike in issues. If impressions stay flat while clicks fall, that pattern points more specifically toward title or snippet performance instead.
That same guidance recommends extending the comparison window, up to sixteen months, to rule out a seasonal or recurring pattern before treating a drop as a genuine anomaly. A dip that looks alarming against last month can look completely normal against the same period a year earlier.
Rank tracking for a defined set of priority terms adds a more targeted signal on top of Search Console’s own reporting lag, though how much faster it actually is depends on the specific tracking provider’s update frequency and query coverage.
Layer 6: Business Outcome Monitoring
Search visibility and rankings act as upstream indicators relative to leads or revenue, though how far upstream depends on a site’s own conversion cycle. This layer closes the loop by connecting those signals to what the business actually cares about.
Organic sessions, qualified leads, and revenue attributed to organic search should be tracked alongside the technical layers, not as a separate report that only surfaces quarterly. Connecting one specific technical incident, a crawl drop, a rendering failure, a ranking decline, to its measurable business impact is also what justifies continued investment in the rest of the stack.
A monitoring system that only reports technical metrics tends to lose executive attention over time. Technical metrics alone rarely make the case for their own budget.
Setting Alert Thresholds and Ownership
A stack that reports everything with equal urgency trains people to ignore it. Each layer needs a threshold calibrated to what actually deserves immediate attention versus what belongs in a weekly review.
Availability and crawl-blocking issues warrant an immediate alert, since they can affect the entire site’s ability to be found. Performance and structured data regressions on high-value templates warrant a same-day review; the impact is real but rarely urgent within hours. Gradual ranking shifts are usually better suited to a weekly or biweekly review than an alert, since normal day-to-day fluctuation would otherwise trigger a false alarm constantly.
A defensible threshold generally comes from a few inputs together, not a number that just feels roughly right:
- A baseline drawn from the metric’s own historical variance, not an arbitrary round number
- Thresholds set separately per template or cohort, so a smaller high-value segment’s problem doesn’t get masked by one sitewide number
- Absolute and percentage changes tracked separately, so a small template isn’t flagged for normal noise while a large one’s smaller percentage shift still gets caught
- A minimum volume requirement, so low-traffic pages don’t trigger alerts on statistically meaningless swings
- Known seasonal periods suppressed or adjusted for
- Release annotations tied to the monitoring timeline, so a spike can be checked against what actually shipped that day
- More than one corroborating signal required before escalating, where possible, since two or three layers moving together is a stronger case than one noisy metric alone
A rough default, adjustable to a site’s actual risk tolerance and release frequency, looks like this:
| Signal | Typical response |
| Site down, crawler blocked, mass 5xx errors | Immediate alert, treated as an incident |
| Crawl or indexation drop on priority templates | Same-day review |
| Core Web Vitals regression on a high-value template | Same-day to next-day review |
| Structured data error introduced by a release | Next-day review, tied to the release that shipped it |
| Gradual visibility or ranking movement | Weekly or biweekly review, not an individual alert |
Ownership matters as much as the threshold itself. In Growzify’s experience, stacks reporting to a shared inbox nobody’s specifically accountable for tend to generate alerts that sit unread. Stacks with one named owner per layer, even if that person delegates the actual investigation, are far more likely to result in something getting fixed.
A Composite Example: Building a Monitoring Stack for a Retail Marketplace
The following is an illustrative, composite scenario built from patterns Growzify sees across enterprise reviews, not a specific named client.
Consider a retail marketplace with several hundred thousand product pages that has relied entirely on quarterly technical audits. Without a monitoring stack, a platform deployment that silently changes how the product template generates canonical tags could plausibly go undetected until the next scheduled audit finally catches it, potentially months later.
With a template regression check in place as part of a six-layer stack, that same category of change could instead be flagged within days of the deployment that introduced it, before it has time to affect a meaningful share of the catalog’s indexation. Even then, a fast catch wouldn’t be the end of the process; the team would still need to check Search Console’s indexation data and organic performance for the affected category over the following weeks to confirm the early flag actually reflected a real, contained issue rather than assuming detection speed alone proved no damage occurred.
Common Mistakes When Building a Monitoring Stack
Instrumenting only the easy layers.Uptime and Core Web Vitals dashboards are common because the tools are readily available, but a stack missing crawl, indexation, and structured data monitoring has real blind spots, however polished the rest of it looks.
Alerting on everything at the same urgency.A flood of low-priority alerts trains the team to stop checking, which defeats the entire purpose of building the stack.
Building the stack without an owner for each layer.Data flowing into a dashboard nobody’s accountable for tends to sit unreviewed until something forces someone to look, by which point the early-warning value is already lost.
Treating the stack as a full replacement for audits.Continuous monitoring catches regressions and anomalies well. It’s generally not suited to the kind of comprehensive, full-inventory review a structured audit provides.
Frequently Asked Questions
How is a monitoring stack different from just running audits more often?
An audit, even a frequent one, is still a snapshot taken at a point in time. A monitoring stack runs continuously, which is what lets it catch a regression days after it happens instead of waiting for the next scheduled check, whenever that falls.
What’s the minimum viable monitoring stack for a large site just getting started?
Availability monitoring plus Search Console’s Crawl Stats and Page Indexing reports form a reasonable starting point, since they cover the layers where a problem can affect the most pages fastest. Search Console itself provides the core crawl and indexing data at no additional software cost; availability monitoring can generally run through whichever infrastructure-monitoring system the organization already has in place. Structured data and rendering monitoring are usually the next additions once those foundations are working.
Who should own the monitoring stack, SEO or engineering?
Both, for different layers. In Growzify’s experience, SEO typically owns crawl, indexation, and visibility monitoring, while engineering is better positioned to own availability and infrastructure monitoring, with structured data and rendering monitoring often shared depending on who actually builds the templates.
How often should alert thresholds be reviewed?
Whenever the pattern of alerts stops matching reality, either because the team is being flooded with low-value alerts or because something genuinely important slipped through without triggering one. A fixed review schedule isn’t strictly necessary if the thresholds are working, but it’s worth checking after any major platform change.
Does a monitoring stack replace the need for a technical SEO audit?
No. A structured audit still provides the full-inventory review a monitoring stack isn’t designed to replace. The stack catches regressions and anomalies between audits; the audit still provides the periodic, comprehensive check the stack was never built to substitute for.
Where This Fits Into the Bigger Picture
A monitoring stack is what turns technical SEO from a periodic project into an ongoing operating discipline. It’s also what feeds the evidence a roadmap needs to reprioritize when something changes mid-cycle. Growzify’sguide to building an SEO roadmap for a large websitecovers how that evidence turns into a scored, sequenced plan once the stack surfaces something worth acting on.
If your organization is still relying on periodic audits alone to catch technical problems on a large site, Growzify’senterprise SEO servicesteam builds monitoring stacks like this one around your actual platform and data access, and connects the output directly into the roadmap and reporting work that follows.

Chitranshu SharmaA growth strategist, digital marketing consultant, and the founder of Growzify, a performance-driven agency helping brands dominate search, shape perception, and build sustainable online visibility. With 8+ years of hands-on experience in Enterprise SEO, Online Reputation Management (ORM), and AI-led traffic generation, Chitranshu has helped startups, public figures, SaaS companies, and cannabis brands outrank competitors — ethically and at scale.
Explore More Articles
How to Find and Compare Local SEO Outsourcing Providers
How to Find and Compare Local SEO Outsourcing Providers Finding a local SEO outsourcing provider...
October 13, 2026Outsourcing

Inside a White Label SEO Campaign: How the Work Gets Done
Inside a White Label SEO Campaign: How the Work Gets Done Clients see a single...
October 13, 2026White Label

How to Vet an SEO Outsourcing Provider Before You Sign a Contract
How to Vet an SEO Outsourcing Provider Before You Sign a Contract A polished proposal...
October 9, 2026Outsourcing

Multilingual SEO Best Practices: Optimize Your Multi-Language Website
Multilingual SEO Best Practices: Optimize Your Multi-Language Website Translating a page and localizing it for...
October 7, 2026SEO
What Makes In-House Enterprise SEO Work Different Day-to-Day?
What Makes In-House Enterprise SEO Work Different Day-to-Day? On a small site, deciding to fix...
October 7, 2026Enterprise
How Core Algorithm Updates Impact Large Sites Differently Than Small Ones
How Core Algorithm Updates Impact Large Sites Differently Than Small Ones A large enterprise site...
October 7, 2026Enterprise
When Should You Outsource SEO? 11 Signs It Makes Sense
When Should You Outsource SEO? 11 Signs It Makes Sense Outsourcing SEO does not necessarily...
September 26, 2026Outsourcing